| Delphi Clinic | C++Builder Gate | Training & Consultancy | Delphi Notes Weblog | Dr.Bob's Webshop |
| Delphi Clinic | C++Builder Gate | Training & Consultancy | Delphi Notes Weblog | Dr.Bob's Webshop |
|
Delphi is based on components. This means we need a new way of optimising our applications. Traditionally, we used a tool like Turbo Profiler to find the efficiency bottlenecks in our application - a top down approach. With Delphi, the application consists of components that interact together, so we can use a bottom up approach, where we leave the application itself intact, but focus on optimising the underlying components.
Performance Optimisation
First of all, we must divide the process of performance optimisation into seven phases:
After we performed the first four or five steps, we know for certain that the (stand-alone!) executable (EXE, DLL, OCX) is as fast as possible.
Yet, this doesn't mean that the application doesn't need fine tuning.
Especially in a Client/Server, or N-tier (internet) environment, we need to perform additional steps to ensure maximum efficiency.
During the Delphi Efficiency session in San Diego, we'll spend some time exploring steps 6. and 7. by building a 2-Tier database application, using TClientDataSet and Providers.
Client/Server Database Optimisation Techniques involve table and (SQL) query manipulation and optimisation. We'll see a number of useful techniques that can be applied. N-Tier Distributed Application Optimisation Techniques focus on minimising band-width (network traffic) to increase efficiency. We'll explore techniques to measure the number of bytes sent from the server (or middle-ware) to the client, etc.
Step 1. Prepare!
Before we even start to think about Performance Optimisation, it is time to check out the compiler options of Delphi on our development machine.
Although compiler options have less impact than a bad algorithm, it can seriously slow down our code and expand our total code size.
My personal project options for Delphi 32 (Delphi 2.x and higher) are as follows (note the checked "Default", which means that these options are now default for every new project in Delphi on my machine):
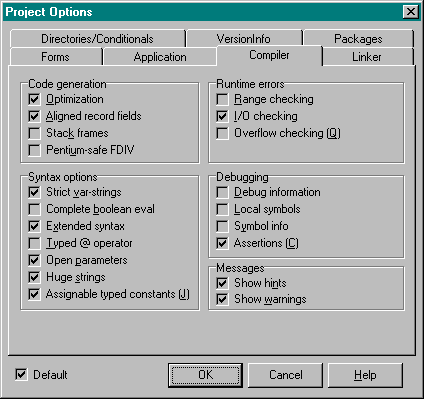
Compared to the 16-bits Delphi Project Options - Compiler page, there are a few new things.
There is now an "Optimization" option.
Frankly, I don't know why we should want to have this one turned off.
It only takes a fraction longer to compile and link than without it, so why not use it all the time?
The only reason I can think of is to enable debugging the application without fear of variables or call stack being eliminated through optimisation!
However, turning optimisations off or on can make a difference in program behaviour, so we should test (and possibly debug) the application with and without optimisation if needed.
Another change is the "Aligned record fields" opion, that will align fields within records to 32-bit boundaries.
In Win32 land, this field alignment means faster execution compared to non-alignment, since DWORD-sized items on DWORD addresses are accessed much faster than on DWORD-odd addresses.
Note that we must use this option with care if we're porting 16-bits Delphi code to 32-bit, since the record layout may change, which is especially harmful if we're reading or writing files that contain these (previously non-aligned) records.
We must use the new keyword packed in these cases, to make sure the records are packed like before.
The "Stack frames" option forces the compiler to generate stack frames on all procedures and functions.
Using this option will slow down our performance, but may enhance debugging capabilities.
Another new compiler directive Delphi 2 introduced is "Huge strings", a local switch directive, which controls the use of long string types.
This $H directive switches the meaning of the reserved word string, when used alone in a type declaration.
With $H+ a string refers to a new, longer counted string type called AnsiString.
This is the default setting.
With $H- a string refers to a 255-character string (or the ShortString type), as in Delphi 1.0.
In Delphi 1.0 we could define "typed constants", of the form "Const X: Integer = 42;".
Delphi 32 now sees these definitions as non-changable, and we can use "Var X: Integer = 42;" to define pre-initialised global variables.
To make sure our old 16-bits Delphi code (that uses typed constants that are changed in other places in the code) still compiles, we need to set the "Assignable typed constants" or $J option.
New in Delphi 3 (and 4) is the "C Assertions" compiler directive, which allows us to use C-style assertions in our Delphi ObjectPascal code.
Real nice for debugging, and it invokes no overhead whatsoever, so I always have this option checked.
Finally, the "Show hints" and "Show warnings" will only help us while writing code.
They may identify that we've declared variables that are never used, or assigned a negative value to a Word, and many more.
32-bit Optimisations
The new 32-bit native code compiler achieves it's performance increase by using a number of new code optimisation techniques.
Unfortunately, we cannot select one or more of these techniques on an individual basis; it's either all or nothing (depending on the "optimization" switch).
The optimisation techniques that Delphi 32 uses include register optimisations, call stack overhead elimination, common subexpression removal, loop induction variables which result in faster performance for a lot of code.
Register Optimisations
Heavily used variables and parameters will automatically be placed into registers, reducing the number of machine instructions required to load, access and store a variable.
This results in much faster code since there is no need to load variables from memory into registers.
This optimisation is done automatically by the compiler with no need to specify that certain variables or parameters should be placed in registers.
The compiler also automatically performs variable "lifetime analysis" in order to be able to re-use registers.
For example, if a variable I is used exclusively in one section of code and a variable J is used exclusively in later section of code, the compiler will use a single register for both I and J.
Call Stack Overhead Elimination
When possible, parameters passed to functions or procedures will be placed in CPU registers also.
Not only does this eliminate the memory access similar to the earlier described register optimisation, but it also means that there is no need to setup a "stack frame" in which to store the values temporarily.
This eliminates additional instructions to create and destroy the stack frame so that function calls are as efficient as possible.
In practice I found it important to minimise the number of arguments to functions and procedures to enable the compiler to pass them all in registers.
The compiler uses three registers to pass values in: EAX, EDX and ECX, so if we have more than three parameters, chances are high that the compiler won't find that many free registers, so it needs to set up a stack frame after all).
Common Subexpression Elimination
As the compiler translates complex mathematical expressions, for example, it will ensure that any common subexpressions, that is computations that would be performed more than once, will be eliminated.
This allows us to write code in a manner that is clear and easy to read, knowing that the compiler will automatically reduce it to its most compact and efficient form.
Very helpful!
Loop Induction Variables
The compiler automatically uses loop induction variables as a way to speed up access to arrays or strings within loops.
If a variable is used only as an index into an array, for example in a for loop, the compiler will "induce" the variable, eliminating multiplication operations and replacing them with a pointer that is incremented to access items in the array.
In addition, if the variable size is a 1, 4 or 8, Intel scale indexing is used to provide additional performance benefits.
Code Elimination
Code elimination?
Will the compiler remove my code?
Well, yes, if we've written code that is not used, then the optimising compiler can decide to remove lines that have no effect.
Note that this is different from removing "dead code", as this code is not dead (it can be reached) it just doesn't have any effect!
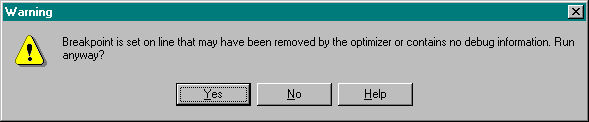
For example in the following program, the second last line before the "end" is removed from the executable when we have optimisation enabled (and the last line before the "end" should have been removed as well, if not for Long Strings).
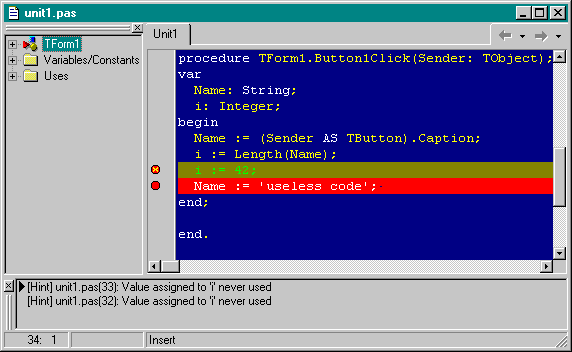
This means we still can set a breakpoint to it, but it won't get triggered! Fortunately, the Delphi IDE will give us a warning when we try to run this program (with the two breakpoints):
Note that we will get to the breakpoint on the line with the String assignment. And we didn't get a warning about it either. So it seems that there's a lot going on behind the scenes of (Long) String assignments (which we'll explore in detail in a short while).
Step 2. Finding Bottlenecks
Never think you know where performance bottlenecks are in your code.
Always measure with some kind of tool, like a profiler.
For 32-bit Delphi code, we can use TurboPower Software's Sleuth StopWatch.
Alternately, we should use one of the other profiling techniques we will examine here, but never think you know before you measure.
We could accidentally be right, but when using profiling tools and techniques we'll be sure to find all bottlenecks!
When using Turbo Profiler, we need to set the following compiler and linker options: {$D+,L+,Y+} and include the TDW debug info in the executable
(Turbo Profiler and Turbo Debugger are internally actually very much alike).
Turbo Profiler
Unfortunately, Delphi does not include a Profiler itself.
The 16-bits Turbo Profiler 2.2 which came with Borland Pascal is unable to read the debug format of a 16-bits Delphi ("program linked with wrong linker version").
Only Turbo Profiler 4.5x that came with BC++ 4.5x is able to read the debug info generated by Delphi 1.0!
For the 32-bit version(s) of Delphi there is no profiler from Borland, but we can use Sleuth StopWatch from TurboPower Software.
Using a Profiler on our Delphi code, we can apply a top-down search for the bottlenecks.
First we must identify the component where we spend most of the execution time.
Within this component, we have to identify the methods that take up most of our time.
Finally, we can profile all lines within the most time consuming method of this component.
16-bits Windows
32-bit Windows
The GetTickCount API gives us the number of milliseconds since Windows was started.
The accuracy of this API, however, is only 55 ms, as it is updated 18.2 times each second (just like the real mode system clock).
Hence, we should use GetTickCount only for very rough measurements.
Also, as the result is stored in a LongInt, its value will overflow after about 49 days, although I've never found anyone who had been able to get Windows 3.x up and running that long to verify.
From the MMSYSTEM.DLL we can use the function timeGetTime (at index 607), which returns a LongInt.
This API is accurate to one millisecond, better than the 55ms.
accuracy of GetTickCount, and can be used for fine measurements.
function timeGetTime: Longint; external 'MMSYSTEM' index 607;
These two APIs only show the total amount of time that has elapsed during a certain operation (i.e. from a certain part of our program until another part, without taking into account the time that other applications consumed during this time period).
The GetTickCount function is also available in Win32, and is in fact identical to the GetCurrentTime function.
We should use the GetTickCount function because its name matches more closely what the function does.
Note that the GetTickCount and GetMessageTime functions return different times.
GetMessageTime returns the Windows time when the given message was created, not the current Windows time.
The 32-bit version of timeGetTime retrieves the system time, in milliseconds.
The system time is again the time elapsed since Windows was started.
There is also another 32-bit API to do roughly the same thing: timeGetSystemTime.
The only difference between this timeGetTime and timeGetSystemTime is that the latter uses the MMTIME structure to return the system time.
The timeGetTime function has less overhead than timeGetSystemTime.
Note that the value returned by the timeGetTime function is a DWORD value (we should use a longint).
For timeGetTime on Windows NT the default precision can be five milliseconds or more, depending on the machine.
We can use the timeBeginPeriod and timeEndPeriod functions to increase the precision of timeGetTime.
If we do so, the minimum difference between successive values returned by timeGetTime can be as large as the minimum period value set using timeBeginPeriod and timeEndPeriod.
Use the QueryPerformanceCounter and QueryPerformanceFrequency functions to measure short time intervals at a high resolution.
For timeGetTime on Windows 95 the default precision of the timeGetTime function is 1 millisecond.
In other words, the timeGetTime function can return successive values that differ by just 1 millisecond.
This is true no matter what calls have been made to the timeBeginPeriod and timeEndPeriod functions.
Note that most of these methods might actually return incorrect results due to the multi-threading nature of Win32. We cannot use a system timer to perform timings of algorithms because Win32 may timeslice to another thread while our algorithm executes (and the clock still ticks). For truly accurate and thread-independent timings on Windows NT, we need to look into the Win32 API routines GetThreadTimes and GetProcessTimes. The advantage of these is that they give you both elapsed time, and the time spent actually executing code in your thread (or process) (Reference: Jeffrey Richter "Advanced Windows" (2nd edition)). So, with GetThreadTimes and GetProcessTimes we can just ignore the time spent while the system was multi-tasking doing something else! Unfortunately, this API is not supported under Windows 95, which leads to the shocking conclusion that for truly accurate profiling results, we need to run on Windows NT.
Step 3. Algorithms & Datastructures
With every application that needs a performance boost, we first need to find the bottle-neck.
We just don't simply start to optimise a program, we need to focus our attention on a specific target; the bottle-neck in speed.
Once we've found the bottlenecks in our application, the first thing we must do is check the used algorithm or datastructures.
Chances are that an inefficient one is used, and we can speed up the application by an order of magnitude by implementing a more efficient one.
Examples of more efficient algorithms to replace an inefficient one are: a Binary Search to replace a Linear Search, a Quick Sort to replace a Bubble Sort, or a BTree to replace a linear linked list.
In order to understand why a binary search is faster than a linear search, we need to focus on Algorithm Analysis.
Algorithm Analysis
Algorithm analysis focuses on the run-time behaviour of the algorithm in space and time efficiency.
We often use the Big-Oh notation to express the running-time order of an algorithm.
Given a set of N input arguments (like a list of N elements), an algorithm is said to be O(N) if the running-time of the algorithm is a linear function of the number of elements N.
Searching for an item in an unsorted list is an example of an algorithm that is O(N).
Likewise, an algorithm is said to be O(log N) if it takes only "log N" steps to perform the task at hand; like searching for a certain item in an ordered list using binary search (by-the-way: tell me honestly, have you ever used binary search when looking for a person's phone number in the phone book?).
We can distinguish the following important O(N) running-time behaviours:
| O(N) | behaviour |
| c | Constant |
| log N | Logarithmic |
| N | Linear |
| N log N | linear-logarithmic |
| N*N | Quadratic |
| N*N*N | Cubic |
| 2**N | Exponential |
In practice, we'll mostly meet algorithms with a Logarithmic, Linear, Linear-Logarithmic or Quadratic behaviour.
An algorithm with a Big-Oh slower than Quadratic is often not very practical (even quadratic is often not usable for large input sets).
Using this Big-Oh information, we can predict that an algorithm will be slower or faster than another algorithm.
A Bubble Sort of O(N2), for example, is much slower than a Quick Sort which has an average case of O(N log N).
Just fill in N=1000 for a list of 1000 elements that needs to be sorted, and we'll see that Bubble Sort will need O(1,000,000) operations, while Quick Sort can do it in O(10,000) - the difference between one second and two minutes!
For operations, we can substitute a certain amount of work that need to be done in the so-called inner loop of the algorithm.
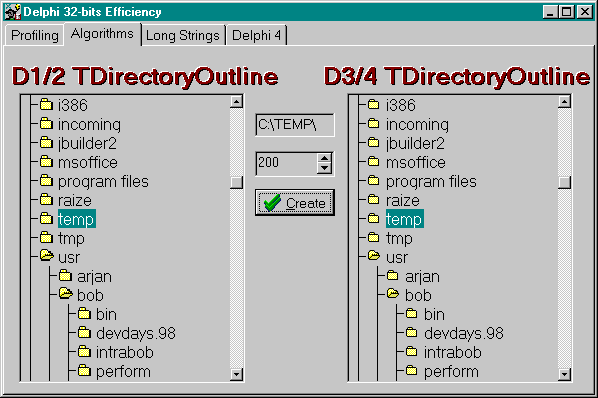
Example
TDirectoryOutline
Note: Since TurboPower's Sleuth StopWatch was not shipping at the time of writing, this paper will only feature the 16-bits Turbo Profiler output of the tests/measurements of the TDirectoryOutline component.
After we've found the bottle-neck in the 16-bits version, we will return to the 32-bit version and see if the same bottle-neck exists there (it will), and fix it for Delphi 32 as well.
Since we already determined that a possible bottle-neck can be found in the TDirectoryOutline component, I fired up Turbo Profiler 4.5, and marked each method of TDirectoryOutline as an active area for the profiler.
After running the program for a short while, we get the following accumulated results for the three most significant routines (the only ones that account for more than 1% of the time):
During the second session of the Turbo Profiler, I've narrowed my search to each line of the procedures Expand and BuildOneLevel.
I also made sure my reaction times were fast, and prepared a path to browse through a couple of large directories and quite right after.
The results were clear:
If we take a look at the source code of the TDirectoryOutline component (which can be found in \DELPHI\SOURCE\SAMPLES for Delphi 1 and in \Program Files\Borland\Delphi 2\Source\Samples for Delphi 2), then we can find the exact place of the bottle-neck!
It appears that the TDirectoryOutline component uses an extremely slow method (linear insertion) of adding new subdirectory entries to a directory in the outliner.
We could turn the sorting off, of course, although the component itself does not offer this feature in its current state.
A better solution is to analyse the used algorithm, and prove it (by designing a faster algorithm)!
Algorithm Design
Bottom-Up Efficiency
Don't forget to replace the two bottle-neck lines in BuildOneLevel with a single call to FindIndex, like below:
The funny thing is that the TDirectoryOutline component is "fixed" in Delphi 3 (and 4).
And if you check the DIROUTLN.PAS file in the SOURCE/SAMPLES directory, you'll see a FindIndex function that really closely resembles the one described here in this paper.
Including the semi-colons which I always remove before the 'end' statements...
What better way to illustrate this point by building a little application with Delphi?
The following example will show that Delphi 1.x and 2.x had a performance bottle-neck which was fixed in Delphi 3 and higher (in fact, Delphi 3 and 4 now use the exact solution presented here).
Start a new project, and drop a DriveComboBox, a DirectoryOutliner, a FileListBox and a few Buttons on a form.
Connect the DriveComboBox with the DirectoryOutLiner, and the DirectoryOutLiner with the FileListBox like this (note that the code is written for the onChange events, and we only need to type the two lines between begin and end):
  procedure TMainForm.DriveComboBox1Change(Sender: TObject);
  begin
    DirectoryOutLine1.Drive := DriveComboBox1.Drive;
  end;

  procedure TMainForm.DirectoryOutline1Change(Sender: TObject);
  begin
    FileListBox1.Directory := DirectoryOutline1.Directory;
  end;
If we run the example program, we see that it takes a noticeable time to load the directory outliner.
If we change to a directory with a lot of subdirectories (like 100 or so), and open it up for the first time, we even have to wait more than 10 seconds before the outliner is drawn again.
Let's try to decrease this time to less than 1 second!
I've included the full source for the procedure Expand, to illustrate an important danger when using Turbo Profiler on a Windows application.
Are we measuring internal calculations, or are we measuring end-user reaction times and input speed to the user interface?
It occurs to me that the procedure Click is just an user input event handler, and the call to inherited Expand is just a call to paint the outliner on screen.
Turbo Profiler for Windows Version 4.5              procedure TDirectoryOutline.Expand(Index: Longint);
              begin
                if Items[Index].Data = nil then
                  BuildOneLevel(Index);
                inherited Expand(Index);
              end;
DIROUTLN.TDIRECT         12   4% |+++
                 15.081 sec  74% |******************************************

              procedure TDirectoryOutline.Click;
DIROUTLN.TDIRECT          9   3% |++
                 2.4617 sec  11% |*******

              procedure TDirectoryOutline.BuildOneLevel(RootItem: Longint);
DIROUTLN.TDIRECT         11   4% |++
                 1.7952 sec   8% |*****
Using TurboPower's Sleuth StopWatch we are able to perform a similar test on 32-bit Delphi and C++Builder applications.
Within a given module/unit, the Sleuth StopWatch will measure every selected routine and generate statistics for the time spent in each routine, the number of times called, total time, average time etc.
This is very helpful information, and in the current TDirectoryOutline example it will directly point to the TDirectoryOutline.BuildOneLevel and TDirectoryOutline.Expand routines (skipping the Click event).
Again, three places account for almost 95% of the time spent in the application.
Line #250 is the call to inherited Expand (which indeed turns out to call the paint routine of the outliner).
The procedure Click is now below 1%, since almost no time was wasted waiting for user input.
Turbo Profiler for Windows Version 4.5
Program: C:\DELPHI\DR-BOB\PERFORM2\PROJPERF.EXE
Execution Profile
Total time: 32.513 sec
% of total: 99 %
Run: 1 of 1
Filter: Module DIROUTLN
Show: Time and counts
Sort: Frequency Pass count: +++ Time: ***
DIROUTLN.172 5180 42% |++++++++++++++++++++++++++++++++++++++++++
12.076 sec 37% |***************************************
DIROUTLN.171 5326 43% |++++++++++++++++++++++++++++++++++++++++++
11.684 sec 36% |**************************************
DIROUTLN.250 5 <1% |
6.9955 sec 21% |**********************
The two major time eaters are part of a linear search algorithm, with efficiency O(N * N), in procedure BuildOneLevel, that is used to place new nodes in alphabetic order under their parent:
  0.0002 151    if RootNode.HasItems then
                { if root has children, then must alphabetise }
                begin
  0.1655 146      TempChild := RootNode.GetFirstChild;
                     { Dr. Bottle-neck: Linear Search applied: }
  11.684 5326     while (TempChild <> InvalidIndex) and
                        (Items[TempChild].Text < searchrec.name) do
  12.076 5180       tempchild := rootnode.getnextchild(tempchild);
  0.1105 146      if TempChild <> InvalidIndex then
  0.6892 132        NewChild := Insert(TempChild, SearchRec.Name)
  0.0115 14       else NewChild := Add(RootNode.GetLastChild,
                                       SearchRec.Name);
  0.0001 146    end
Let's go back to performance optimisation again.
Suppose we've found a bottle-neck in our code, and we can identify the algorithm that's been used at that particular place (say, a simple bubble sort to sort the items in a pick list).
Now, it's time to see what other algorithm might be used in this place.
Often, we can simply pick a book and read what other algorithms exist to perform a certain task (like sorting).
If that's the case, then we simply have to pick the algorithm that looks most promising for the given situation, also taking into account the time it'll take us to actually implement it.
If we cannot find a replacement algorithm, we'll have to design one by ourself.
In that case, we'll know on beforehand what Big-Oh behaviour we'll have to beat.
So, on to the drawing board, to design a truly unique algorithm for our particular case that'll run in, say O(N log N) instead of O(N * N).
In order to enhance the performance of TDirectoryOutline, we have to modify DIROUTLN.PAS.
Personally, I've just made a copy of this file, and placed it in my current project directory.
Now, any enhancements we make in DIROUTLN.PAS will have a direct effect on the whole project and application itself, since the "local" version of the TDirectoryOutline code (and .DCU file) will override the one in the Component Library!
I call this feature "bottom-up efficiency", as it enables us to write more efficient versions of components, and just enhance efficiency by simply recompiling the applications that use these components!
Specifically, if we use a better algorithm (like binary insertion) for TDirectoryOutline, we can get a tenfold increase in speed.
Now, a directory with 100 subdirectories takes under a second to load.
The binary insertion code, with efficiency O(N log N), we used for the tenfold increase in speed is placed in a local routine of procedure BuildOneLevel:
  function FindIndex(RootNode: TOutLineNode; SearchName: TFileName): LongInt;
  var FirstChild,LastChild,TempChild: LongInt;
  begin
    FirstChild := RootNode.GetFirstChild;
    if (FirstChild = InvalidIndex) or
       (SearchName <= items[firstchild].text) then
         FindIndex := FirstChild
    else
    begin
      LastChild := RootNode.GetLastChild;
      if (SearchName >= Items[LastChild].Text) then
        FindIndex := InvalidIndex
      else
      begin
        repeat
          TempChild := (FirstChild + LastChild) div 2; { binary search }
          if (TempChild = FirstChild) then Inc(TempChild);
          if (SearchName > Items[TempChild].Text) then
            FirstChild := TempChild
          else LastChild := TempChild
        until FirstChild >= (LastChild-1);
        FindIndex := LastChild
      end
    end
  end {FindIndex};
TempChild := FindIndex(RootNode, SearchRec.Name); { Dr. Bob }
The new TDirectoryOutline component for both versions of Delphi has been optimised in speed by using a better algorithm.
All we needed to do was to find the bottle-neck, analyse the used algorithm and design a new (and faster) one.
Sometimes, changing an algorithm isn't enough. Maybe because the algorithm is too simple (or complex) to be optimised. In those cases, it may be time to examine the ObjectPascal language constructs that are used near or at the bottle-neck instead.
Step 4. Delphi Language Enhancements
The Delphi ObjectPascal language contains many new helpful features for programmers who are concerned with efficiency.
Virtual vs. Dynamic
For starters, we now have two ways to indicate whether or not a method can be overrided in a descendant class.
We can use either virtual or dynamic.
The difference is the algorithm that is used to find the correct (polymorphic) method at run-time.
Using virtual, the compiler will find the correct method by walking the VMT of the instance.
Using dynamic, the compiler will use another algorithm, that uses less storage space, but is slower.
So, again we see here a trade-off between size and speed, and Delphi offers us the chance to make our own decisions about it!
If we want a small program, or need a faster one, check our virtual and dynamic routines, and see if we can gain the one we desire.
It turns out that a dynamic method is about 50% slower than a virtual method call. Note that this only tells us something about the call, since the actual work inside the polymorphic routine has to be taken into account as well in a real-world situation.
Run-Time Type Information
Exceptions
Raising exceptions doesn't take forever anymore.
But this doesn't mean it's safe to use them in very tight loops!
The original recommendation still stands, abeit a little bit less urgent.
Finally
Variants
Typecasting variants
Long Strings
Copy for Free
Delayed Performance Hit
RTTI enables Delphi to identify each instance of a class.
This is used, for example, by the Object Inspector to display the properties of a class instance.
But we can use RTTI to our own advantage, too, using the two new keywords IS and AS.
Using IS we can check whether or not an instance IS of a specific class type, while the AS can be used to do a RTTI-safe typecast (one that will raise an exception if RTTI identifies the cast invalid).
  if Sender IS TButton then
    with Sender AS TButton do ...
Note that we can omit the AS, and use an untyped cast since the IS operator already identifies Sender being of type TButton.
Hence, the last line could read
with TButton(Sender) do ...
As we can see in the figure above, it's generally even faster to do the IS-check followed by the untyped cast, than to do a clean AS-construct!
Delphi exceptions, including the new keywords try, except on X do, and raise offer a new way of detecting and handling errors.
A lot of programmers, however, are concerned about the efficiency of exceptions compared to regular error handling.
My timings have shown that the use of exceptions has no significant effect on the performance of a certain piece of code, as long as the regular (non-exception) path is followed.
In the case that an exception is raised, I noticed a slight overhead using Delphi 1 on Win 3.x (which seemed to be fixed for Delphi 2.01 and up running on Win32).
But what the heck, we don't mind waiting just a little bit longer to get an error message anyway.
This does mean, however, that exceptions should not be used in tight loops where the exception is just part of the execution flow (like reading a text file, and raising an "end-of-line" exception at the end of each line).
This kind of programming will slow down our application, since for each exception that is raised, an instance of EException is created, our stack is cleared and walked to the nearest on except handler.
For normal error detection and handling, exceptions are just fine, and often make the code that much more readable!
For example: create a stringgrid with a lot of rows, and make the last row the total of the values in the other rows (in this column), by using the following code:
  Sum := 0;
  for R:=1 to 12 do
  begin
    try
      Value := StrToFloat(Cells[Column,R]);
    except { Warning: will also get fired when the cell contains empty '' }
      Value := 0
    end;
    Sum := Sum + Value
  end;
  Cells[Column,13] := FloatToStr(Sum)
The mechanism of exception handling takes time to execute, which is the reason why, for an almost empty grid, it takes a few seconds before we enter another cell.
It's not the calculation of the column totals, but the raising and especially the handling of the exceptions that takes a relatively enormous amount of time.
So, for our real world applications: use exceptions to indicate errors that must be responded to, but never use them in the normal flow of control (unless we don't care about the performance of your application).
Measurements of the try-finally block that also was introduced with Delphi exceptions don't indicate any significant performance loss either.
This, combined with the fact that a try-finally block is a very helpful way to safeguard resources and prevent any leakages, makes the try-finally-block my preferred way of programming!
Delphi 2 introduced variant types to give us the flexibility to dynamically change the type of a variable.
This is useful when implementing OLE automation or certain kinds of database operations where the parameter types on the server are unknown to our Delphi-built client application.
A variant type is a 16-byte structure that has type information embedded in it along with its value, which can represent a string, integer, or floating-point value.
The compiler recognizes the standard type identifier Variant as the declaration of a variant.
In most cases we can use a variant just as we would any other type of variable.
Variants are propably designed mainly to service OLE automation, where the server and controller are built in different environments, using different basic data types and calling conventions.
In those cases, the controller can convert its calling arguments into variant types before passing them to the server, which must in its turn recreate them into a value it understands.
We can typecast a standard-type expression into a variant or a variant expression into a standard type.
If we have range-checking turned on, casting a variant into a value outside the range of the type being cast raises an exception.
Note that a Variant inflicts a lot of processing overhead.
All this automatic variant type value conversion behind the scenes surely must cost something.
Well, indeed it does.
Even if not converting, it must still access the type information to check whether or not it needs to convert.
Marco Cantu and I have once done some measurements of the performance of variant type conversions compared to no conversions (using native types), and came to the startling conclusion that the performance hit is more than one order of magnitude.
This means that not using Variants leads to code that is more than ten times as fast as code that uses Variants.
And this is when reading and writing the values only.
Which means that whenever we're working in a tight loop, or have some critical section of code, we should take real care about using Variants.
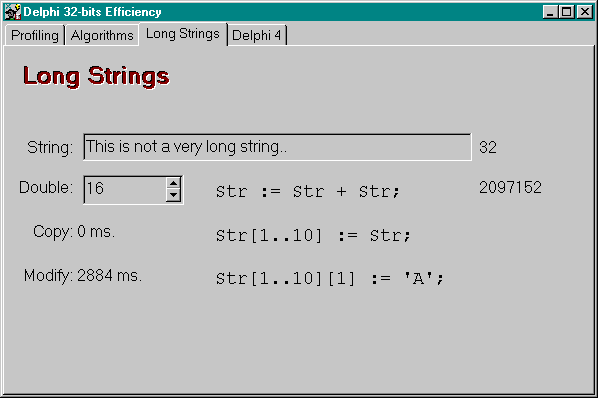
Let's investigate some unexpected potential efficiency problems when using Long Strings in your applications.
Delphi Long Strings are reference counted.
And you'd need such a mechanism if you'd have to store multiple copies of the same long string (which each can be up to 2Gb) without too much overhead.
Any long string that gets created, gets allocated on the heap and has an initial reference count of one (1).
And if you make a copy (either explicitly, or by passing it as value argument to a procedure or function), the reference counter is increased.
If the original or copy goes out of scope, then the reference counter is decreased.
This goes on until the reference counter is zero (0), at which time the entire Long String is deallocated again.
Well, this leads to the following conclusion: copying a long string in Delphi is essentially free, since all you do is have a new pointer to the (same) long string and increase the reference counter.
This is a big advantage over short strings, where copying a short string could be a huge performance problem (like passing a value short string argument to a short string function, where both the argument and function result needs to be copied - a lengthy and time costly process).
But what if we modify one of the copies of the long string? Won't we modify any other copies as well? Well, at that particular point in execution, Delphi will notice that the long string we're about to modify has a reference count greater than 1.
So, it needs to make sure the long string to be modified gets its own "version" of the long string (with reference count of 1).
This also results in the original long string having a reference counter decreased by one (since the modified copy is no longer a copy of it).
Making an actual "deep" copy of a long string takes time, of course.
Even more time that simply copying a short string, since a long string often needs more work (it can be a lot longer, right?).
This is what I've called a delayed performance hit.
A delayed performance hit is what you see when you modify a single character in a long string, and get an unexpected high delay, because the entire (copy of the) long string needs to be re-allocated to make the modification.
To illustrate this point, I've written a little program that creates a long string by making copies of itself in absolutely no time flat.
Then, I modify one character in each of these copies, which does take measurable time, because now the reference counted strings need to be actually split and individually allocated.
And that's a delayed performance hit, and you need to be aware of that when playing with long strings in your applications.
Delphi 4
Delphi 4 introduced a number of new language features, like Default Parameters, Function and Method Overloading, etc.
Among the new features that can have a performance impact are Dynamic Arrays and Int64.
Int64
Delphi 4 introduces a new 64-bits integer type, called Int64, with a whopping range of -2^63..2^63 - 1 (I don't even know how much this is without executing the following program):
Dynamic Arrays
we can now also declare dynamic arrays.
Dynamic arrays specify type information (the number of dimensions and the type of the elements) but not the number of elements.
Thus
declares two dynamic arrays.
X is a one-dimensional arrays of Integer, while M is a two dimensional array of Integers (like a Matrix).
Dynamic arrays do not have a fixed size or length.
Instead, memory for a dynamic array is (re-)allocated when we assign a value to the array or pass it to the SetLength procedure.
Hence, the above declarations for X and M do not allocate memory.
To create the array in memory, call SetLength.
For example, given the declarations above,
allocates an array of 42 Strings, indexed 0 to 41.
Dynamic arrays are always integer-indexed, always starting from 0.
After calling SetLength, the previous content of the dynamic array - if any - is copied along (so data never gets lost if we constantly increase or decrease the length of the array).
Using the above knowledge, we can write a small - and very inefficient, of course - program to read a number of lines from a textfile, and only allocate the exact number of strings that are needed.
Dynamic-array variables are implicitly pointers and are managed by the same reference-counting technique used for Long Strings.
To deallocate a dynamic array, assign nil to a variable that references the array or pass the variable to Finalize; either of these methods disposes of the array, provided there are no other references to it.
If X and Y are variables of the same dynamic-array type, X:=Y allocates X to the length of Y and points X to the same array as Y.
Unlike strings, arrays are not automatically copied (i.e. made unique) before they are written to, but they keep pointed to the same - shared - memory area!
For example, after this code executes
the value of X[0] is 7.
Unlike Long Strings, that get "split" when we change one of them (to get a unique copy), dynamic arrays keep pointed to the same area.
A bit unexpected, perhaps, but at least we don't get delayed performance hits (like with Long Strings)...
Assigning to a dynamic-array index (for example, X[42] := 7) does not reallocate the array (we need to call SetLength to do that).
Out-of-range indexes are not reported at compile time, but will raise an exception at run-time (with $R+ compiler directive).
To truncate a dynamic array, pass it to the Copy function and assign the result back to the array variable.
For example, if X is a dynamic array, X := Copy(X, 0, 2) truncates all but the first 2 elements of X.
Once a dynamic array has been allocated, we can pass it to the standard functions Length, High, and Low.
Length returns the number of elements in the array, High returns the array's highest possible index (Length - 1), and Low always returns 0.
For a zero-length array, High indeed returns -1, so in that case High(X) < low(x).
To instantiate the multi-dimensional array M (see declaration on top of this paper), we need to call SetLength with two integer arguments:
allocates an 10-by-5 array, and M[9,4] denotes an element of that array.
We can also create multidimensional dynamic arrays that are not rectangular.
The first step is to call SetLength, passing it parameters for the first n dimensions of the array.
For example,
allocates ten rows for M but no columns.
Then, we can allocate the columns one at a time (giving them different lengths); for example
makes the third column of M 42 integers long.
At this point (even if the other columns haven't been allocated) we can assign values to the third column for example, M[2,41] := 7.
Dynamic v. Static Arrays
Step 6. Databases - Tables and SQL
TSession
TQuery
TTable
General BDE Tips
Step 7. Distributed Applications
Network Traffic
TClientDataSet
TBDataSetProvider
During the session, we'll be using this new TBDataSetProvider component to detect a potential performance problem when using TClientDataSets in combination with TDBGrid components on a remote BDE table.
Conclusions
Bibliography
  program Delphi4;
  uses
    SysUtils, Dialogs;

  const
    MinInt64 = $8000000000000000;
    MaxInt64 = $7FFFFFFFFFFFFFFF;

  begin
    ShowMessage('Int64: '+IntToStr(MinInt64)+'..'+IntToStr(MaxInt64))
  end.
And after executing the above program, it's hard to grasp how big these numbers actually are.
Very big, that's for sure.
And once you define an integer constant that's too big to fit in an integer (i.e. a signed 32-bit integer constant), then the compiler will automatically reserve an Int64 to hold this value.
Of course, everything comes with a price.
In this case, it's speed.
Since an Int64 is not a native machine integer, it has to be "simulated" by Delphi 4.
And that means it takes more time than simply working with a 32-bit integer.
  program LongInt64;
  {$APPTYPE CONSOLE}
  {$O-}
  {$A+}
  uses
    MMSystem;

  var
    Start,Stop,Time: LongInt;

    procedure StartTime;
    begin
      Start := timeGetTime;
    end;

    procedure StopTime;
    begin
      Stop := timeGetTime;
      Time := Stop - Start;
    end;

  const
    Max = 1000;

  var
    X1,X2,X3: SmallInt; { 16-bits }
    Y1,Y2,Y3: LongInt; { 32-bit }
    Z1,Z2,Z3: Int64; { 64-bits }

  begin
    StartTime;
    for X1:=1 to Max do
      for X2:=1 to Max do
        X3 := X1 + X2;
    StopTime;
    writeln('SmallInt: ',Time);
    StartTime;
    for Y1:=1 to Max do
      for Y2:=1 to Max do
        Y3 := Y1 + Y2;
    StopTime;
    writeln('Integer: ',Time);
    StartTime;
    Z1 := 0;
    repeat
      Inc(Z1);
      Z2 := 0;
      repeat
        Inc(Z2);
        Z3 := Z1 + Z2
      until Z2 = Max
    until Z1 = Max;
    StopTime;
    writeln('Int64: ',Time);
    StartTime;
    Y1 := 0;
    repeat
      Inc(Y1);
      Y2 := 0;
      repeat
        Inc(Y2);
        Y3 := Y1 + Y2
      until Y2 = Max
    until Y1 = Max;
    StopTime;
    writeln('Integer (repeat): ',Time);
  end.
This output from this program will show that a (32-bit) Integer is slightly faster than a 16-bits SmallInt, but (much) more than twice as fast as a 64-bits Int64 (which is not a native machine type anyway).
So, while Int64 offers great precision, don't just use if for fun, as it will slow down your program at the same time...
In Delphi 4, in addition to declaring static arrays such as
X: Array[1..42] of Integer;
  X: Array of Integer;

  M: Array of Array of Integer;
SetLength(X, 42);
{$R+}
  {$APPTYPE CONSOLE}
  var
    X: Array of String;
    i: Integer;
  begin
    while not eof do
    begin
      SetLength(X,Length(X)+1); // very inefficient...
      readln(X[High(X)])
    end;
    for i:=0 to High(X) do writeln(X[i])
  end.
Warning: we should not apply the dereference operator (^) to a dynamic-array variable or pass it to the New or Dispose procedure.
  var
    X,Y: array of Integer;
  begin
    SetLength(X, 1);
    X[0] := 42;
    Y := X;
    Y[0] := 7;
  end;
Of course, since dynamic array contents are copied when we call SetLength, that's also all it takes (a call to SetLength) to create a unique copy of a dynamic array.
SetLength(M,10,5);
  var
    M: array of array of Integer;
  begin
    SetLength(M,10);
SetLength(M[2], 42);
So, how should dynamic arrays perform when compared to static arrays?
Anyone wants do make a guess??
Faster?
Slower?
Let's wait and see...
  program DynArray;
  {$APPTYPE CONSOLE}
  {$O+}
  {$A+}
  uses
    MMSystem;

  var
    Start,Stop,Time: LongInt;

    procedure StartTime;
    begin
      Start := timeGetTime;
    end;

    procedure StopTime;
    begin
      Stop := timeGetTime;
      Time := Stop - Start;
    end;

  const
    Max = 1000;
  var
    X: Array[0..Pred(Max),0..Pred(Max)] of Integer;
    Y: Array of Array of Integer;
    i,j: Integer;

  begin
    StartTime;
    for i:=0 to Pred(Max) do
      for j:=0 to Pred(Max) do
        X[i,j] := i + i;
    StopTime;
    writeln('Static Array: ',Time);
    StartTime;
    SetLength(Y, Max);
    for i:=0 to Pred(Max) do SetLength(Y[i], Max);
    StopTime;
    writeln('Allocation Dynamic Array: ',Time);
    StartTime;
    for i:=0 to Pred(Max) do
      for j:=0 to Pred(Max) do
        Y[i,j] := i + i;
    StopTime;
    writeln('Dynamic Array: ',Time);
    StartTime;
    Y := nil; // deallocate all at once...!?
    StopTime;
    writeln('Deallocation Dynamic Array: ',Time);
  end.
This program shows that while allocating/decallocating a dynamic array (especially mult-dimensional dynamic arrays) isn't free, but access to a dynamic array can be faster than a static array!
Now that we've optimised the (stand-alone) application, it's time to see how the interaction with the database, tables and queries is performed.
More often than not, the database part of the application (sometimes called "server" in a Client/Server architecture) is responsible for slow response times.
If we use a database (tables) on a shared network, we can enhance efficiency by setting a number of properties of the TSession component.
First of all, Session.PrivateDir should be assigned to a local directory, like C:\WINDOWS\TEMP (you can do this in the OnCreate event of your DataModule, for example).
The PrivateDir will contain the result of a local Query (which is a table in itself), and a local table is of course much faster than a table on the network (LAN or otherwise).
Second, Session.NetFileDir should be assigned to the same physical value for every user, like 'X:\BORLAND.COM\BDE' (this also can be done during initialisation).
When using Parameterized Queries, we should call the Query.Prepare method before filling in any of the Query parameters.
This will significantly increase performance, because prepare will already allocate resources and perform specific optimisations (or at least prepare for them).
from slow to fast, the order is:
There is a slight overhead for calling Prepare, but this will be neglectable when we have more than a few parameter values to substitute.
Are your C/S applications in Delphi using TTables?
If they are, you should consider using TQueries along with Cached Updates (or even TClientDataSets instead of Chached Updates) to improve the performance of your overall application.
TTables give you an easy model for programming and provide adequate performance in lots of cases but are not designed with speed in mind.
Here are a few tips to improve performance of BDE and SQL Links:
The final step we need to perform for maximum application efficiency is focus on distributed application specific bottle-necks, such as (mainly) network traffic.
Heavy Network Trafffic, especially on WAN (such as the internet) can really slow down application efficiency.
As a general rule-of-thumb we should always try to detect and minimise this data flow.
There are many "packet sniffers" available that can help to identify the number of bytes that are sent from one part of your application to another.
However, I found it not always easy to distinguish between data sent from the middle-ware to the (thin) client or fat server, and other data sent from my machine to another.
Instead of observing "from the outside", a better solution is to "take us in" and measure from the inside of our N-Tier application itself.
With TClientDataSet and T(DataSet)Provider, Delphi has a powerful mechanism for building Distributed Applications.
The TClientDataSet is used at the (thin) Client side, while the Data Prodiver is used at the server (or middle-ware) side.
We can use CORBA, (D)COM, OLEnterprise or even plain sockets as communication protocol, but the important thing to remember is that we have a thin client (without the BDE) and a remote server, providing data to the client.
As we've seen in this paper, locating bottle-necks is the most important step when it comes to performance optimisation, and it's no different for distributed applications.
The only (additional) problem this time is being able to actually measure the efficiency; or, in this case, the network traffic.
Fortunately, I've found a way to determine the number of bytes that are transferred from the TDataSetProvider to the TClientDataSet, and this is an important first step!
It turns out that the TDataSetProvider component - on the server side - is being "called" by the TClientDataSet component (using a XXXConnection component, where XXX can be any one of DCOM, ORB, etc).
In fact, when the TClientDataSet component needs more data, it calls the TDataSetProvider.GetRecords method, which then returns a number of new records (based on the value of the PacketRecords property).
With that in mind, it's easy to derive a new component called TBDataSetProdiver that adds the number of bytes of each call to GetRecords to a property BytesTransferred, so we can determine at all times how many bytes have been sent over the network from the server (of middle-ware) to the client.
This is a very powerful performance tuning feature, as it will enable us to see potential bottle-necks that most of us are unaware of.
The source code for the TBDateSetProvider is as follows:
  unit DrBobPro;
  interface
  uses
    Classes, Provider;

  type
    TBDataSetProvider = class(TDataSetProvider)
    public
      constructor Create(AOwner: TComponent); override;
      function GetRecords(Count: Integer;
                      out RecsOut: Integer): OleVariant; override;
    private
      FBytesTransferred: LongInt;
    public
      property BytesTransferred: LongInt read FBytesTransferred;
    end;

    procedure Register;

  implementation

  constructor TBDataSetProvider.Create(AOwner: TComponent);
  begin
    inherited Create(AOwner);
    FBytesTransferred := 0
  end;

  function TBDataSetProvider.GetRecords(Count: Integer;
                                    out RecsOut: Integer): OleVariant;
  begin
    Result := inherited GetRecords(Count, RecsOut);
    if RecsOut > 0 then
      Inc(FBytesTransferred,DataSet.RecordSize * RecsOut);
    // if IsConsole then writeln(FBytesTransferred)
  end;

  procedure Register;
  begin
    RegisterComponents('DrBob',[TBDataSetProvider])
  end;

  end.
In this paper, we've explored numerous tools and techniques that are available when working on Delphi efficiency and performance optimisation.
We've seen a structured performance optimisation process, where we (top-down) break down the application and optimise step by step.
We've also seen special bottom-up optimisation, a feature introduced by the re-usable Component nature of Delphi!
If you have any questions, comments or other feedback, please feel free to contact me at info@eBob42.com.
If you want more interesting and deep-technical information about Delphi Efficiency, then you should check out my articles on this topic in The Delphi Magazine, my old book Borland Pascal Efficiency, or the book titled The Revolutionary Guide to Delphi 32, ISBN 1-874416-67-2 published by WROX Press.